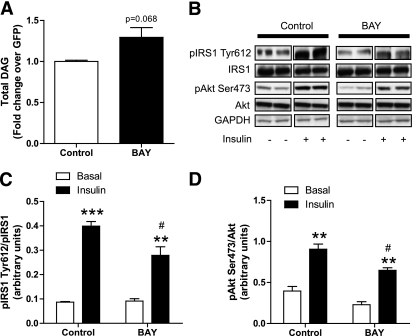
FIG. 7.
Selective HSL inhibition disrupts insulin signaling. A: Total DAGs were measured in control myotubes and myotubes treated for 24 h with 1 μmol/L of the selective HSL inhibitor BAY (n = 6). B: Representative blots of Tyr1162 pIR, total IRalpha, Ser473 pAkt, total Akt, and GAPDH in the presence (+) or absence (−) of insulin in control myotubes and myotubes treated with BAY. Quantitative bar graphs of (C) Tyr612-IRS-1 phosphorylation (n = 4) and (D) Ser473 Akt phosphorylation (n = 4) in control myotubes and myotubes treated with the BAY compound. **P < 0.01; ***P < 0.001 vs. basal; #P < 0.05 vs. control insulin.

