FIG. 5.
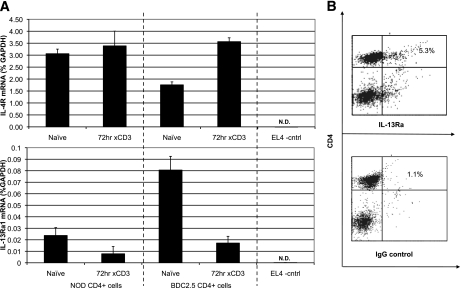
NOD and BDC2.5.TCR.Tg T cells express IL-13Rα1. A: cDNA produced from purified NOD or BDC2.5.TCR.Tg CD4+ cells, before or after culture on anti-CD3–coated plates (72 h) was evaluated by real-time PCR to detect expression of IL-4R mRNA (upper panel) or IL-13Rα1 mRNA (lower panel), relative to GAPDH. The CD4+ EL4 thymoma line served as a negative control – transcripts for GAPDH were detected, whereas mRNA for IL-13Rα1 or IL-4Rα was not detected (N.D.). B: NOD splenocytes were stained with antibodies to TCRαβ, CD4, and IL-13Rα1 (upper plot) or isotype control (lower plot). The plots are gated on TCR+ populations. The numbers in the upper right quadrant indicate percentages of TCR+ cells that are also positive for the designated parameters. The plots shown are a representative experiments performed six times with similar results.

