FIG. 3.
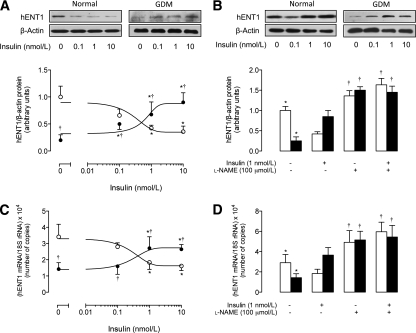
Effect of insulin on hENT1 expression. A: Western blot for hENT1 protein abundance in cells from normal or GDM pregnancies incubated (8 h) without (0 nmol/L) or with insulin. β-Actin was the internal control. Lower panel: hENT1/β-actin ratio densitometries from data in cells from normal (○) or GDM (●) pregnancies, normalized to 1 in cells from normal pregnancies in the absence of insulin. B: Western blot for hENT1 protein abundance in cells incubated (8 h) in the absence (–) or presence (+) of insulin and/or l-NAME. β-Actin was the internal control. Lower panel: hENT1/β-actin ratio densitometries were derived from data in cells from normal (□) or GDM (■) pregnancies, normalized to 1 in cells from normal pregnancies in the absence of insulin. C: Expression of hENT1 mRNA relative to 18S rRNA (internal reference) in number of copies in cells as in A. Quantitative RT-PCR experiments were done in a reaction mix containing 0.5 μmol/L primers, and deoxyribonucleotides triphosphate, Taq DNA polymerase, and reaction buffer provided in the QuantiTect SYBR Green PCR Master Mix (Quiagen, Crawley, U.K.; see research design and methods). D: Expression of hENT1 mRNA in number of copies in cells as in B. In A and C, *P < 0.05 vs. corresponding values in the absence of insulin, †P < 0.05 vs. corresponding values in cells from normal pregnancies. In B and D, *P < 0.05 vs. all other corresponding values in normal or GDM pregnancies. †P < 0.05 vs. corresponding values in normal or GDM pregnancies in the presence of insulin. Error bars in the graphs designate the SEM.

