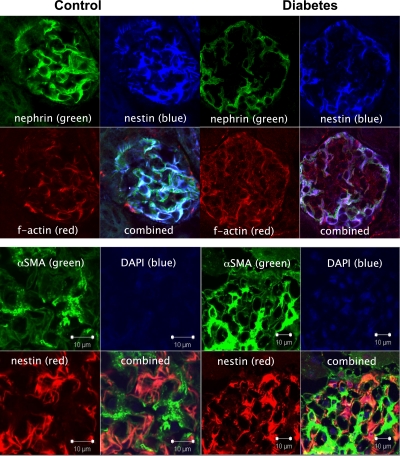
FIG. 7.
Immunofluorescent staining of cortical glomeruli showing expression of the podocyte marker, nephrin (green), f-actin (red), and the intermediate filament, nestin (blue); merged staining from control and diabetic apoE-KO mice (top); and immunostaining of cortical glomeruli showing expression of α-SMA (green), nestin (red), DAPI (blue), and merged (bottom). (A high-quality color representation of this figure is available in the online issue.)

