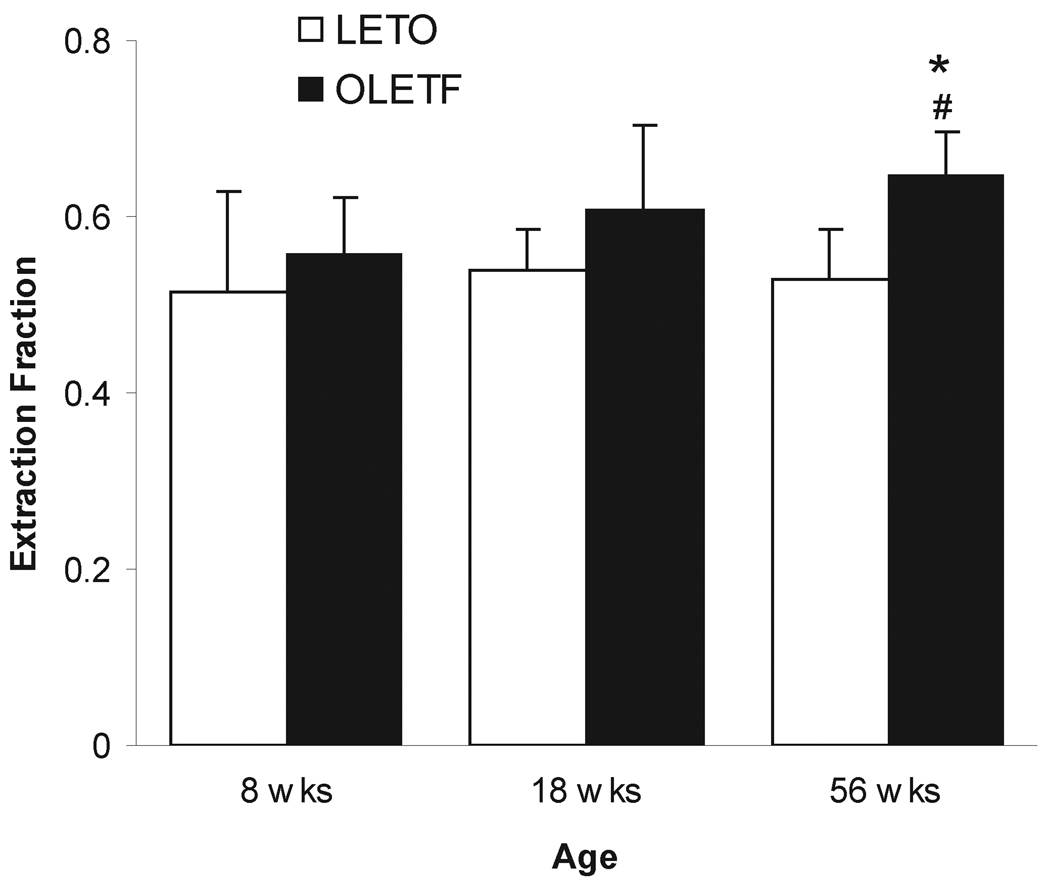
Fig. 2.
No-net-flux microdialysis of DA (mean ± S.D.) in the NAC of LETO (open bars) and OLETF (dashed bars) rats. The slope index of regression line represents the extracellular fraction. *, significant difference between strains, p<0.05; #, significant difference between 56 week age group of OLETF and the 8 as well as 18 week OLETF cohorts, p<0.05.

