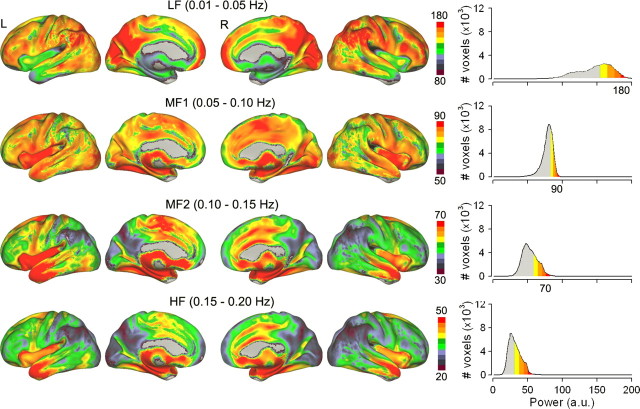
Figure 1.
Spatial structure of power spectral density distribution for BOLD oscillations in the whole brain in resting-state fMRI. Power spectrum of BOLD was subdivided into four equal bands: LF, MF1, MF2, and HF, and power for each band was measured only for gray matter voxels, averaged across subjects (n = 17). The four rows show spatial distribution of mean magnitude of power for each frequency band. Right, Histograms of group-averaged mean power distribution for the four frequency bands, for the entire brain. The lowest-frequency band (LF) has the highest power, and is localized mainly to prefrontal, parietal, and occipital cortex. The higher-frequency bands exhibit less power, and localize more within cingulate, insula, temporal cortex, and subcortical structures. Each row depicts the brain in the sequence of left (L) lateral, L medial, right (R) medial, and R lateral views. Note that the power range is distinct for each row (color bar range), derived from the corresponding histogram (same color code for >70% power).

