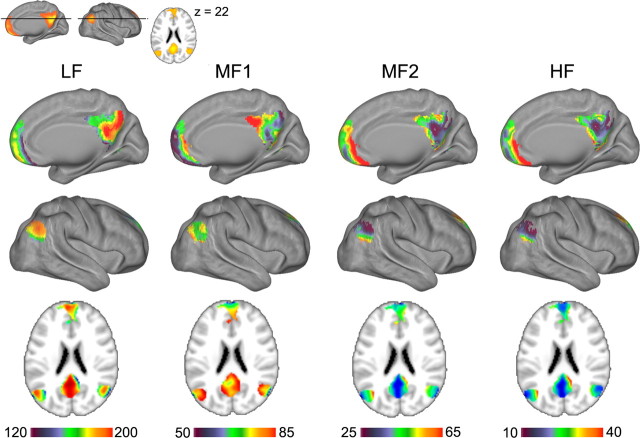
Figure 4.
Spatial structure of power spectral density distribution for BOLD oscillations in the DMN in resting-state fMRI. Top inset depicts the DMN as identified by independent components analysis. The four columns show spatial distribution of mean magnitude of power for each frequency band. Each column shows right medial and lateral views, and a horizontal slice corresponding to the inset.

