Figure 5.
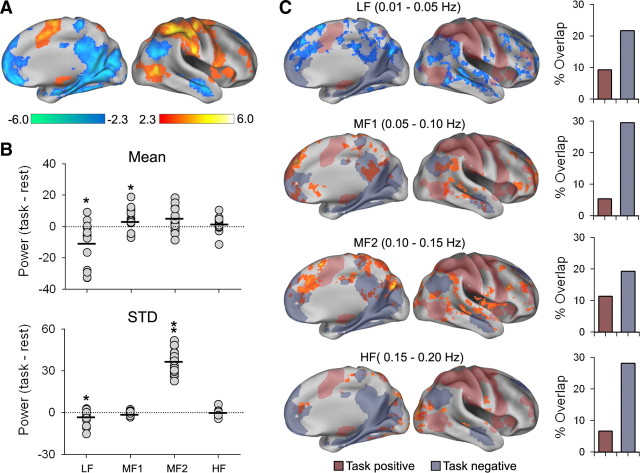
Shifts in power of BOLD oscillations during a task. A, Brain areas increased (red-yellow) and decreased (blue-green) with the task, based on standard GLM (n = 17 subjects; mixed-effects model, z > 2.3 and z < −2.3, cluster p < 0.05, corrected for multiple comparisons). B, Whole-brain changes in the mean and standard deviation (STD) of power distribution for the four bands of BOLD oscillations (each circle is one subject; thick lines = average, paired t test, *p < 0.05). Overall power is decreased in LF band and increased in MF1, while standard deviation is decreased for LF and increased for MF2 band. C, Voxelwise changes in power between rest and task, for each frequency band relative to the task [paired t test, mixed-effects model, z > 2.3 (red) and z < −2.3 (blue), cluster p < 0.05, corrected for multiple comparisons]. In the LF band (top row), only regional decreases in power are observed (blue), and these are localized to areas both within and outside task-positive and task-negative activations, based on GLM analysis (shaded areas). Bottom three rows, Higher-frequency bands show only regional increases in power and these overlap more with task-negative brain regions. The bar graph shows percentage overlap between voxels changing in power and those involved in the task.

