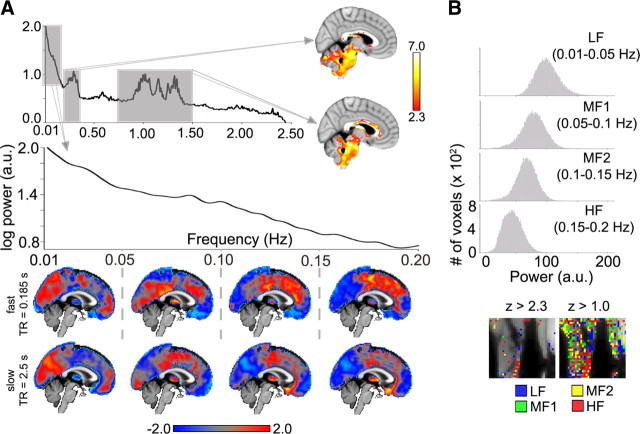
Figure 6.
Two experiments designed to identify possible confounds for spontaneous BOLD oscillations. A, To identify sources of physiological noise resting-state fMRI was done (n = 6 subjects) in a single brain slice, studied with fast scanning, and compared to whole-brain resting fMRI. Group-averaged spectrum (top, for the single slice imaged at TR = 0.185 s) identifies two ranges associated with cardiorespiratory noise (right two gray boxes; 0.2–0.4 Hz and 0.75–1.5 Hz). Group-averaged activity for power within these two specific bands, in the imaged midsagittal slice (right brains labeled with arrows; fixed-effects model, z > 2.3, cluster p < 0.05, corrected for multiple comparisons, accompanying color bar), identifies the brainstem, parts of the cerebellum, and white matter. The fast fMRI scans were examined in the frequency range of the slow data (leftmost box in top power spectrum, arrow: expanded in the lower-power graph). The spatial distribution of frequency band-specific z-scored power for BOLD for the supra-brainstem midsagittal slice is similar between slow and fast scans (bottom two rows of brain images; each column is for a specific frequency band as delimited; top row is mean of n = 6 subjects, fast scan; bottom row is mean of n = 17 subjects, slow scan). The color bar represents average z-scored power. B, To examine the contribution of blood flow to BOLD oscillations, fMRI was done in the leg muscle in one subject. Frequency band-specific power histograms show Gaussian distributions for BOLD signal in the leg (top). z-scored spatial distribution of frequency band-specific power exhibits no clustering comparable to the brain (the one large cluster in LF band is located on a tendon), even at low threshold (right panel).

