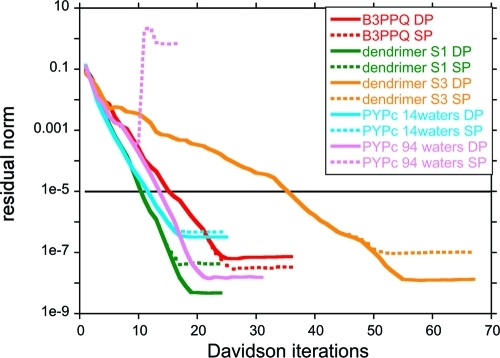
Figure 3.
Plot of single and double precision (SP and DP) convergence behavior for the first CIS/6-31G excited state of five of the benchmark systems. The convergence threshold of 10–5 (norm of residual vector) is indicated with a straight black line. In most cases, convergence behavior is identical for single and double precision integration until very small residual values well below the convergence threshold. A very small percentage of calculations require double precision for convergence. One such example is shown here for a snapshot of the PYP chromophore (PYPc) surrounded by 94 waters.

