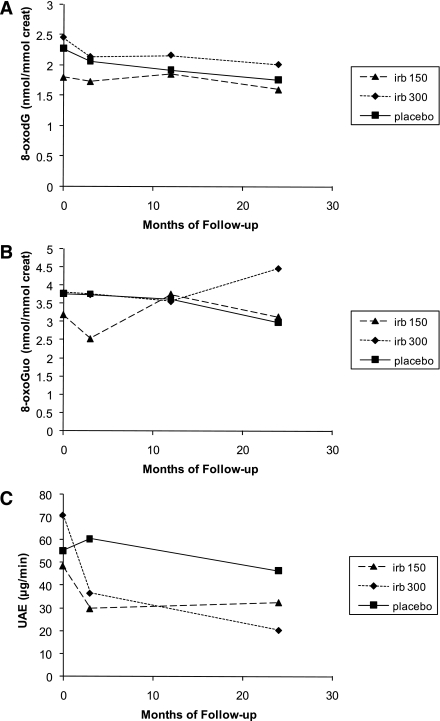
Figure 1.
Change in 8-oxodG (A), 8-oxoGuo (B), and albumin excretion (C) in patients (n = 50) according to treatment group (placebo [n = 17], 150 mg irbesartan [irb] [n = 16], and 300 mg irbesartan [n = 17]). A: Time effect: P = 0.0004; treatment × time effect: P = 0.46. B: Time effect: P = 0.87; treatment × time effect: P = 0.11. C: Time effect: P < 0.0001; treatment × time effect: P = 0.0008. Values are geometric means. creat, creatinine; UAE, urinary albumin excretion.

