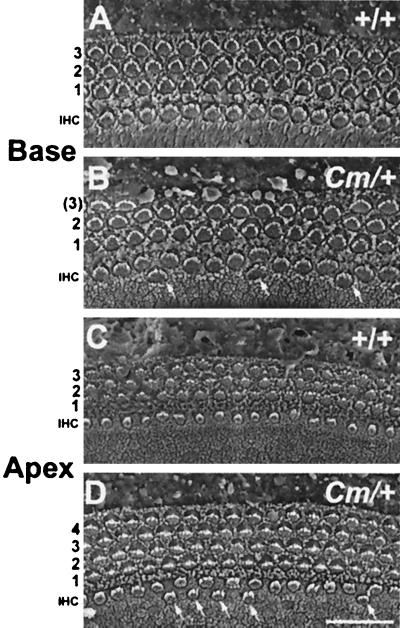
Figure 6.
Scanning electron micrographs of the organ of Corti in Cm/+ mice demonstrate some of the neuroepithelial defects observed in Htu/+ cochleas. A and B are micrographs from the basal coil of the cochlea, and C and D are taken from the apical coil of the cochlea. The position of the inner hair cells (IHC) and the number of outer hair cell rows are indicated on the left. Hair cells that are observed in a second IHC row are indicated by arrows. (Scale bar in D = 20 μm for A–D.)

