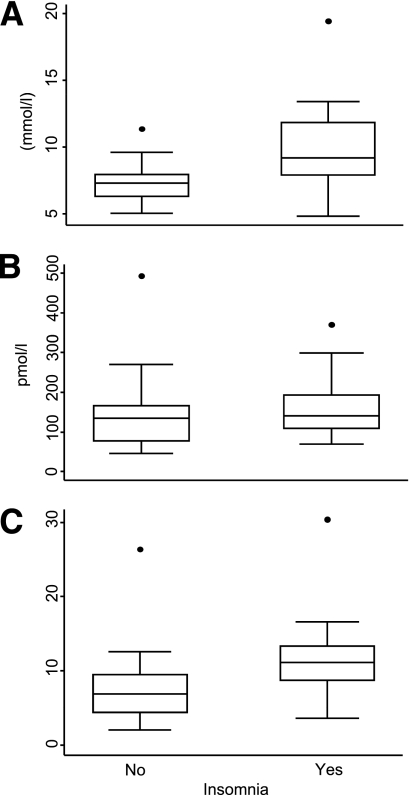
Figure 2.
Box and whisker plots present the unadjusted association between insomnia and fasting glucose (A), insulin (B), and HOMA (C) among subjects with diabetes. The median is marked by the line inside the box, the ends of the box are the 25th and 75th percentiles, the whiskers represent the largest and smallest observed values that are not outliers, and the circles represent an outlier defined as 1.5 × interquartile range.

