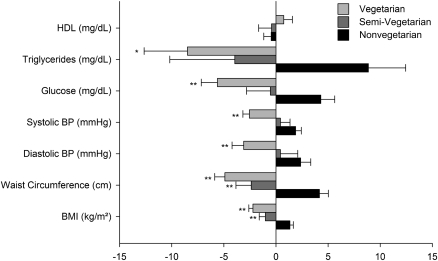
Figure 1.
Dietary pattern and MRFs. Mean-centered values are shown with whiskers representing SE. ANCOVA was used in comparing risk factors stratified by dietary patterns. P values represent contrasts with nonvegetarian dietary pattern, which is the group of reference. *P < 0.05; **P < 0.001. P for trend was < 0.001 for each risk factor with the exception of HDL (P > 0.05). Adjustments were made for age, sex, ethnicity, smoking, alcohol intake, physical activity, and dietary energy intake. BP, blood pressure.

