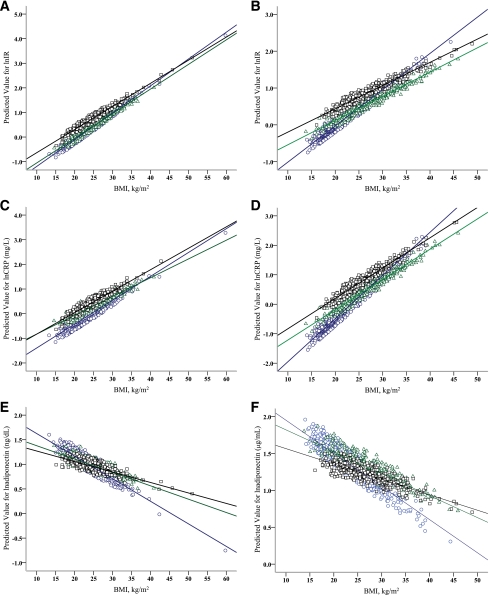
Figure 1.
Age-adjusted fitted regression plots showing relationships between BMI and IR, CRP, and adiponectin in Chinese (○), Malays (△), and Asian-Indians (□), stratified by sex. A: Relationship of IR to BMI in men (P interaction = 0.282). B: Relationship of IR to BMI in women (P interaction < 0.001). C: Relationship of CRP to BMI in men (P interaction = 0.304). D: Relationship of CRP to BMI in women (P interaction < 0.001). E: Relationship of adiponectin to BMI in men (P interaction < 0.001). F: Relationship of adiponectin to BMI in women (P interaction < 0.001).

