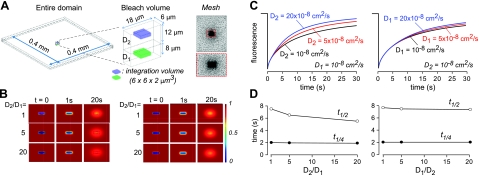
Figure 3.
Finite-element computations of 2-layer diffusion. A) Schematic of bleach geometry for 2-layer diffusion, showing entire computation domain (left panel), 6- × 18- × 20-μm bleach volume and signal integration volume (middle panel), and projected mesh used for computation (right panel), with expanded region in red dashed box. B) Pseudocolored concentration profiles showing relative concentration in bleached rectangular region at t = 0, 1, 20 s in the lower layer (left panel) and upper layer (right panel) for diffusion coefficients: D1 = 10−8 cm2/s, with D2 = 10−8, 5 × 10⁻⁸, 20 × 10−8 cm2/s (left panel); and D2 = 10−8 cm2/s, with D1 = 10−8, 5 × 10⁻⁸, 20 × 10−8 cm2/s (right panel). C) Computed recovery curves: concentration time course in integration volume in the lower layer (z=4 μm; left panel) and upper layer (z=16 μm; right panel), with indicated D1 and D2. D) Times for t1/4 and t1/2 recovery for simulations in C.

