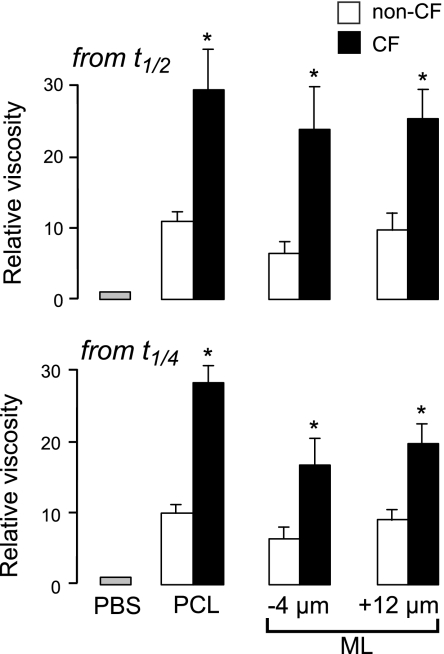
Figure 4.
ASL viscosity in the PCL and ML of non-CF and CF bronchial cell cultures. Summary of relative ASL viscosities at indicated z locations from data as in Fig. 2C, as deduced from fitted t1/2 (top panel) and t1/4 (bottom panel) values (means ± se; n=6–10 cultures/condition from 4 different non-CF and 3 different CF subjects). *P < 0.01 vs. non-CF.

