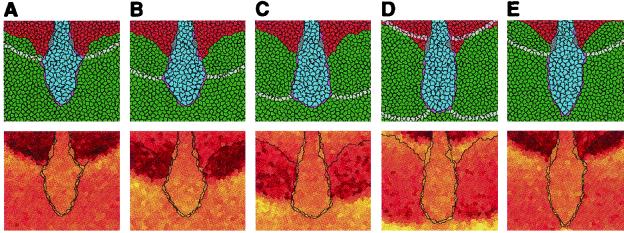
Figure 2.
Detailed view of the stalk elongation during the simulation of Fig. 1. (Upper) Individual cells. Light bands indicate the regions of chemotactic motion toward cAMP. See also Movie 2, which is published as supplemental data on the PNAS web site, www.pnas.org. (Lower) Pressure differences, indicated by the mean cell volume of individual cells, averaged over five samples at intervals of 2 sec. Volumes are indicated by a color gradient from dark red (small volume) to bright yellow (large volume). (A) At 14 min and 40 sec. (B–E) With subsequent intervals of 40 sec. See also Movie 3, which is published as supplemental data.

