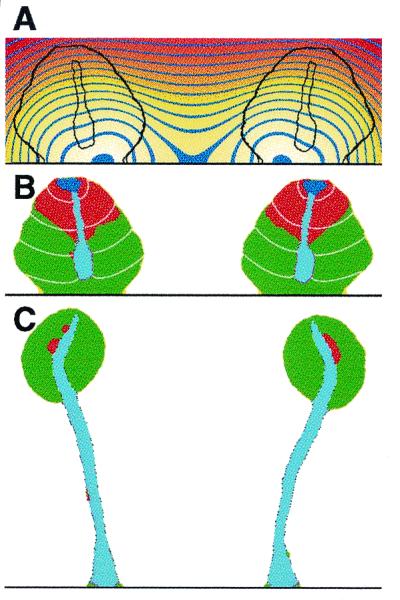
Figure 4.

Snapshot, after 20 min, of two culminants orienting away from each other because of NH3 production. (A) NH3 distribution, indicated by a color gradient from dark red (low concentration) to bright yellow (high concentration), with blue bands of iso-concentration. See also Movie 5, which is published as supplemental data on the PNAS web site, www.pnas.org. (B) The culminants, with slanted stalks. Light bands indicate the cAMP waves. (C) Final configuration after 4 h. See also Movie 6, which is published as supplemental data.
