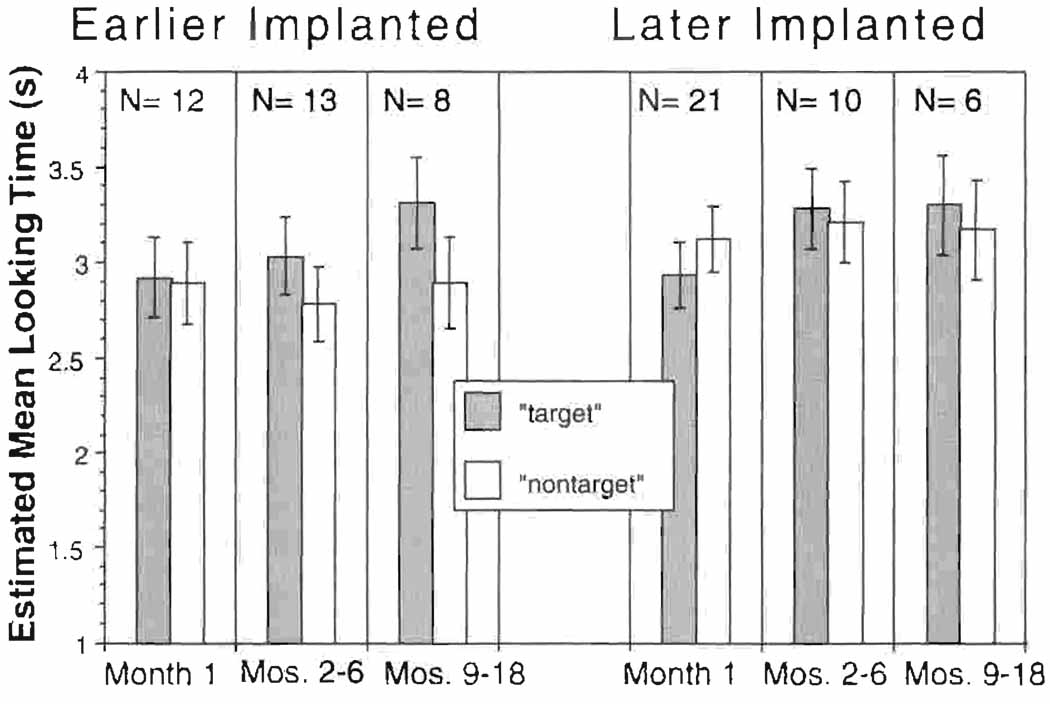
Figure 4.
Estimated mean looking times (and standard error) for infants with cochlear implants. Bars on the left represent infants with very early implantation. Bars on the right represent infants with later implantation. Mean looking times to the target are represented by solid bars, and mean looking times to the non-target are represented by striped bars.

