
Figure 2.
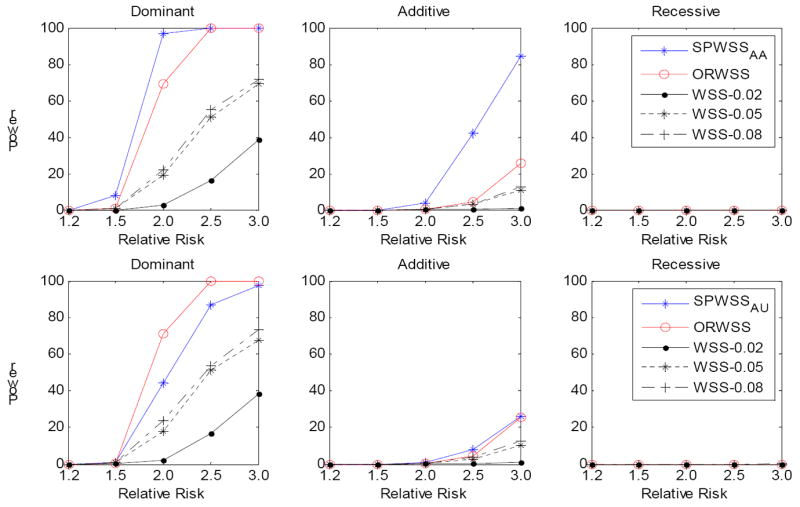
Comparison of power for different relative risk. For each replication, we assumed there is a common risk variant (MAF is between 0.05 and 0.08) and the rest risk variants are rare (MAF<0.02), with a cumulative risk allele frequency of 10%. The power was calculated at significance level α=10-6 based on 1,000 replications. Three disease models have been assumed: Dominant, Additive and Recessive. All the risk alleles were treated the same. Top panel: for SPWSSAA, we simulated 200 affected sibpairs for calculating the weights, and 2,000 cases and 2000 controls for the association test. For ORWSS and WSS, we simulated 2,400 cases and 2,000 controls for the association test. Bottom panel: for SPWSSAU, we simulated 200 discordant sibpairs for calculating the weights, and 2,000 cases and 2000 controls for the association test. For ORWSS and WSS, we simulated 2,200 cases and 2,200 controls for the association test. For WSS, we used different thresholds: 0.02, 0.05 and 0.08 to define the rare variants.