
Figure 4.
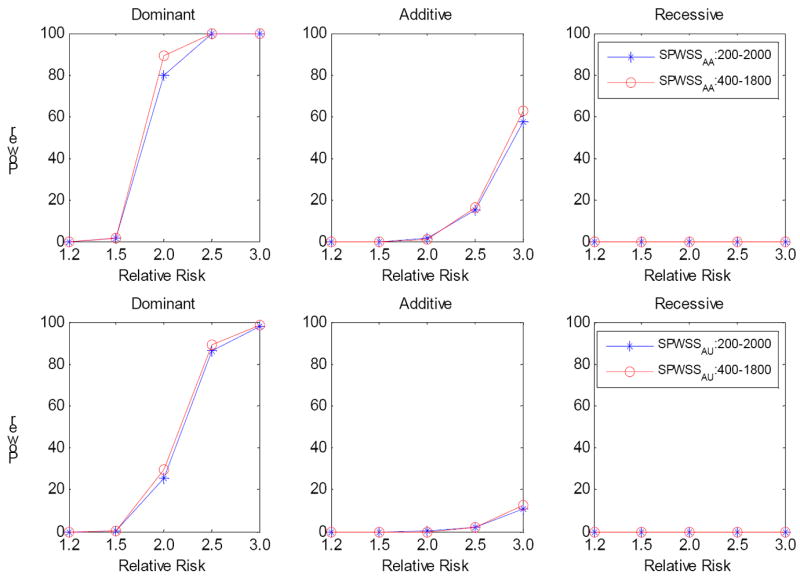
Comparison of power for SPWSS when the total sample size is fixed. The power was calculated at significance level α=10-6 based on 1,000 replications. Three disease models have been assumed: Dominant, Additive and Recessive. All the risk alleles were treated the same. We compared 200 sibpairs, 2000 cases and 2000 controls with 400 sibpairs, 1800 cases and 1800 controls. Top panel: SPWSSAA; Bottom panel: for SPWSSAU.