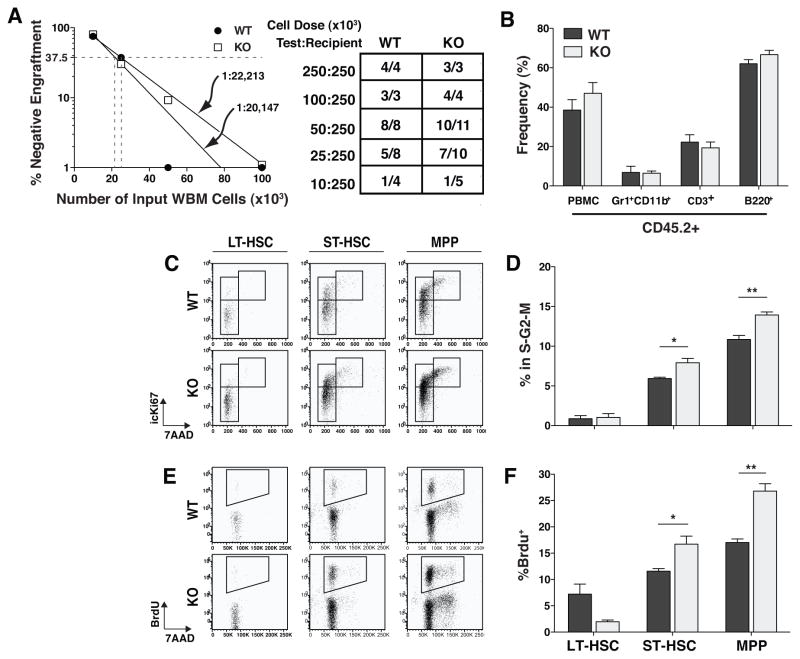
Figure 4. TTP KO multipotent progenitor populations were more actively cycling while LT-HSCs remained quiescent.
A Frequency of engrafting cells as calculated by limiting dilution transplant experiments. Table shows the number of mice that engrafted with WT or KO (CD45.2+) cells at each dose 16 weeks post-transplant. The data are from the combination of two transplant experiments. B Peripheral blood chimerism of mice who received a 1:1 dose of Test:Recipient cells. C Representative FACS plots of cell cycle analysis by icKi67/7-AAD staining. Plots are gated on the primitive population shown. D Frequency of cells in each population in the S-G2-M phase of the cell cycle based on the presence of intracellular Ki67 protein and replicated DNA (icKi67+7-AAD4n). E Representative FACS plots of BrdU incorporation by the primitive cell types shown over a 16hr period in vivo. F Frequencies of BrdU+ cells in each primitive cell population. Statistical analysis by unpaired t-test on n=3 WT and n=3 KO; * p<0.05 and ** p<0.01. Cell cycle and BrdU incorporation experiments were repeated 3 times.

