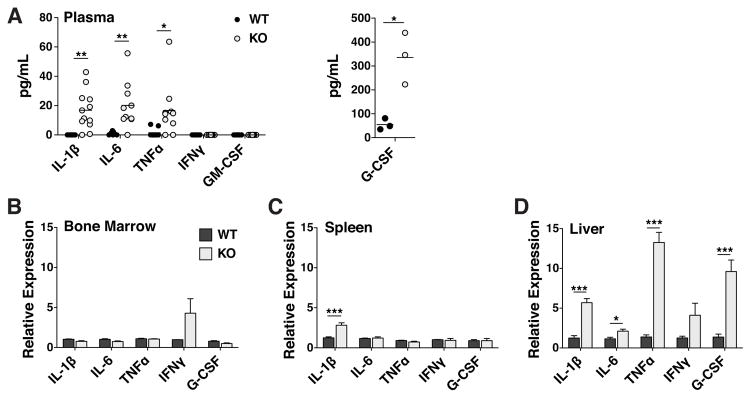
Figure 8. Expression of granulopoietic TTP targets was elevated in TTP KO plasma as a result of increased mRNA expression in KO liver.
A Plasma cytokine concentrations as measured by ELISA. Each point represents a plasma sample from a single mouse, horizontal lines represent the mean value. Statistical analysis by two-way ANOVA; * p<0.05 and ** p<0.01. Relative abundance of cytokine mRNAs quantified by real-time PCR in B Bone Marrow, C Spleen and D Liver. Statistical analysis by unpaired t-test on n=3 WT:WT and n=4 WT:KO; * p<0.05, ** p<0.01 and *** p<0.005.

