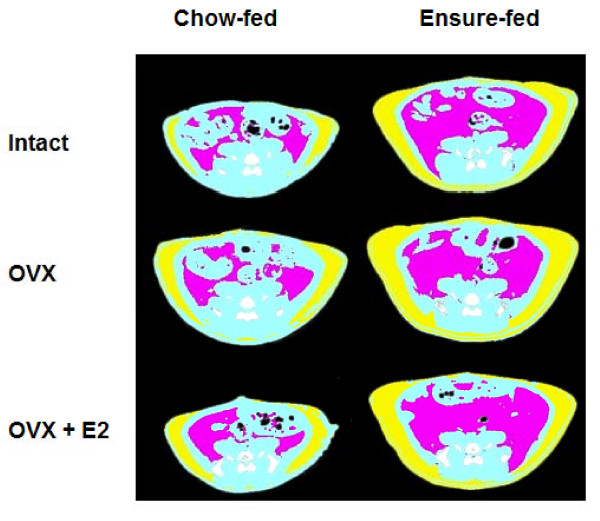
Figure 1.
Representative microCT images. Representative microCT images showing SAT (yellow) and IAAT (magenta) at the level of lumbar vertebra 6 on d 41 in chow-fed and Ensure-fed rats that were sham-operated (Intact), ovariectomized (OVX), or ovariectomized and estradiol-treated (OVX+E2); white/gray is bone, black is air, and blue is the remainder.

