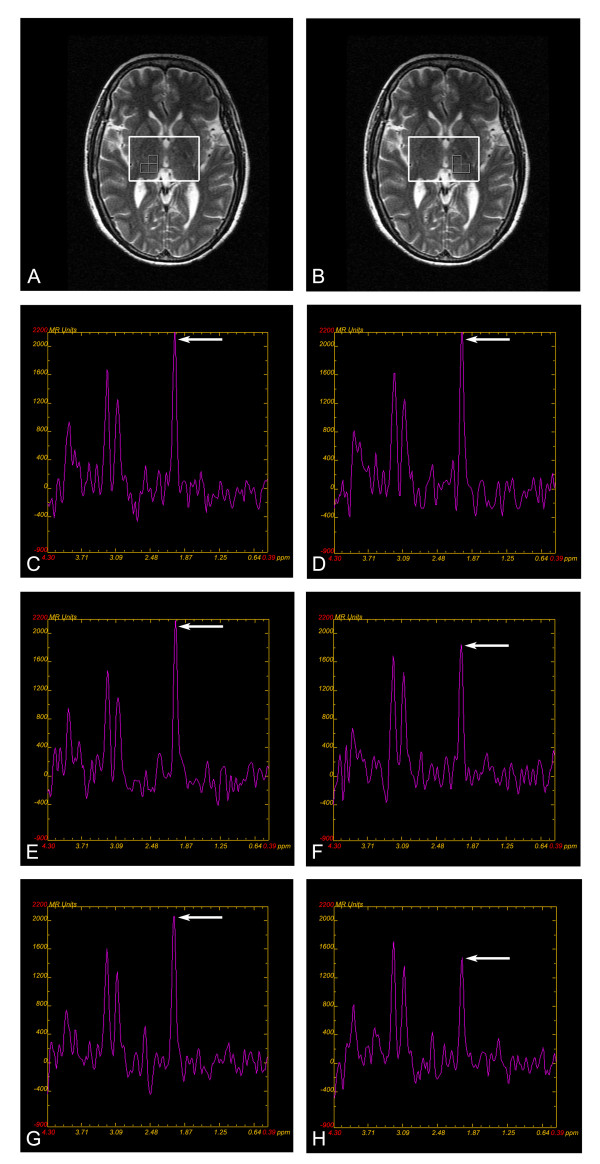
Figure 1.
MRS volume of interest in the right and left thalami and a sample of spectra from a patient. (A) (B) Magnetic resonance spectroscopy (MRS) of the thalamus. T2-weighted image in the axial plane. Placement of the VOI covering the right and left thalami; multi-voxel spectroscopy technique; data is obtained from three adjacent voxels in each side thalamus. Mean peak areas of NAA, Cho and Cr values were determined by averaging three voxels in each side of the thalamus. (C)-(H) A sample of spectra from a patient depicting the values of analyzed metabolites. (C) (D) The spectrum of the ipsilateral and contralateral thalamus at W1. Arrows show NAA peak, which indicates approximately equal NAA value in ipsilateral and contralateral thalamus. (E) (F) The spectrum of the ipsilateral and contralateral thalamus at W4. Arrows show NAA peak, which indicates NAA value is lower in the in ipsilateral than that in contralateral thalamus. (G) (H) The spectrum of the ipsilateral and contralateral thalamus at W12. Arrows show NAA peak, which indicates NAA value is further lower in the in ipsilateral than that in contralateral thalamus

