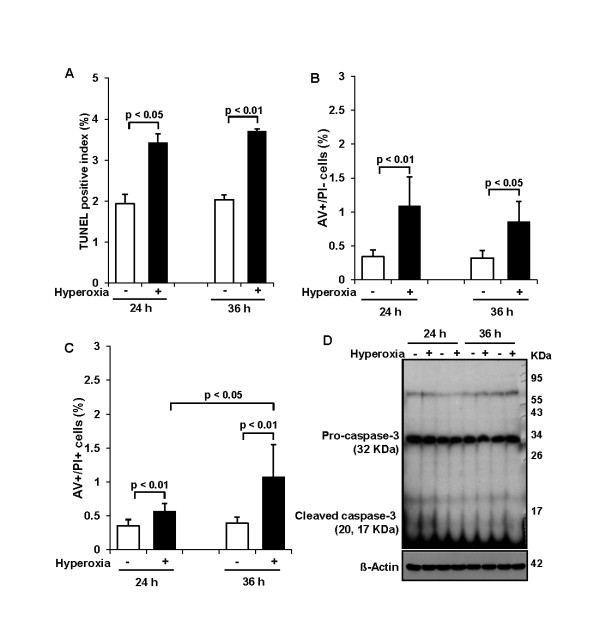
Figure 2.
Effect of 65%-hyperoxia on fetal type II cell apoptosis. (A) Graphical depiction showing detection and quantification of DNA fragmentation analyzed by TUNEL assay in normoxic and hyperoxic cells. The results are represented as the mean ± SD from 3 different experiments. (B) Graphical depiction showing early apoptotic cells (selective AV-positive cells) as a percentage of the total cell number in normoxic and hyperoxic cells. The results are represented as the mean ± SD from 6 different experiments. (C) Graphical depiction showing late apoptotic or necrotic cells (AV-positive and PI-positive cells) as a percentage of the total cell number in normoxic and hyperoxic cells. The results are represented as the mean ± SD from 6 different experiments. (D) Western blot showing level of cleaved caspase-3 and abundance of full-length of procaspase-3 during 65%-hyperoxia.

