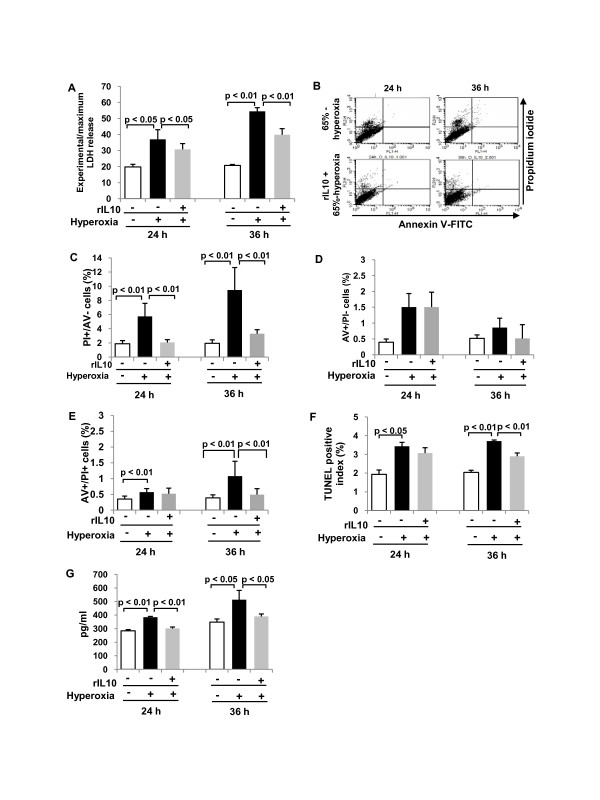
Figure 6.
IL-10 decreases cell death and IL-8 in fetal type II cells exposed to 65%-hyperoxia. E19 cells were preincubated with a concentration of 300 ng/ml of rat rIL-10 before exposing to 65%-hyperoxia for 24 h and 36 h. Samples were processed to assess cellular necrosis, apoptosis and IL-8 released into the supernatant. (A) Graphical depiction showing LDH-release in treated and untreated cells. The results are represented as the mean ± SD from 3 different experiments. (B) Graphical depiction showing distribution of cellular necrosis measured by selective PI staining in treated and untreated cells. (C) Graphical depiction showing cellular necrosis (PI-positive and AV-negative cells) expressed as a percentage of the total cell number in treated and untreated cells. The results are represented as the mean ± SD from 6 different experiments. (D) Graphical depiction showing early apoptotic cells (selective AV-positive cells) assessed by FACscan in treated and untreated cells. The results are represented as the mean ± SD from 6 different experiments. (E) Graphical depiction showing late apoptotic or necrotic cells (AV-positive and PI-positive cells) assessed by FACscan in treated and untreated cells. The results are represented as the mean ± SD from 6 different experiments. (F) Graphical depiction showing DNA fragmentation assessed by TUNEL assay in treated and untreated cells. The results are represented as the mean ± SD from 3 different experiments. (G) Graphical depiction showing IL-8 released into the supernatant in treated and untreated cells. The results are represented as the mean ± SD from 3 different experiments.

