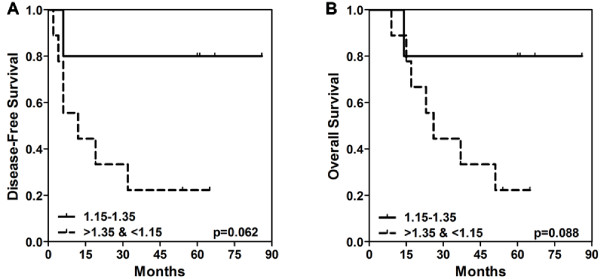
Figure 4.
Disease-free and overall survival analysis in melanoma patient lymphocytes. Kaplan-Meier survival curves were generated to assess the correlation of STAT1 activation with A) disease-free survival (p = 0.062) and, B) overall survival (p = 0.088). A ratio for each patient was calculated by dividing the fold induction of pSTAT1 in post-treated lymphocytes by the fold induction of pSTAT1 in pre-treated lymphocytes (post/pre). A median of these ratios was generated (1.25) using all patients in the study (n = 14) and patients were segregated according to whether they fell within a range of ± 0.1 around the median. P-values < 0.05 were considered significant.

