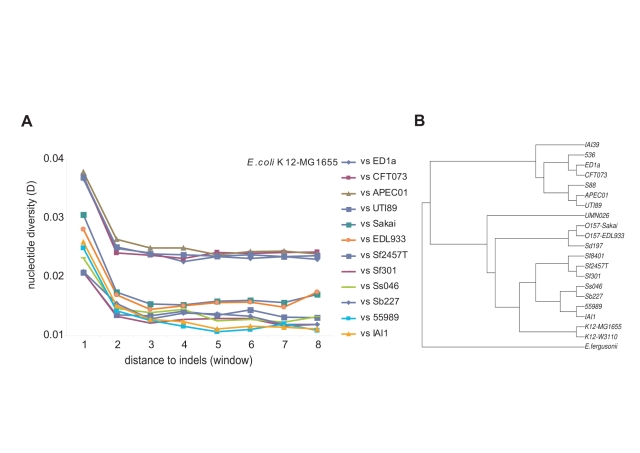
Figure 1. Nucleotide diversity increases with proximity to indels.
(A) Twelve pairwise alignments between E. coli K12 MG1655 and other E. coli genomes are shown. Each number on the x-axis refers to a sequence window of defined size (Figure S1). The legend lists the comparisons in descending order of values of D for sequence window 1. A further six pairwise comparisons were omitted from this figure for clarity (see Table S4). (B) A phylogenetic tree constructed from 1,868 genes conserved in all 20 E. coli genomes used in this study as well as E. fergusonii (this phylogeny is adapted from Touchon et al., 2009 [34]).

