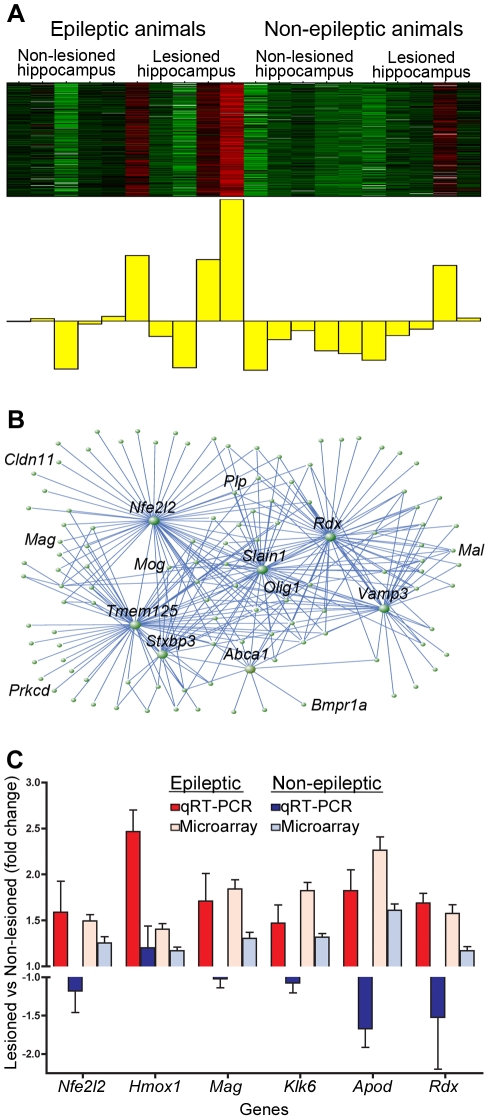
Figure 5. Yellow co-expression module contains genes upregulated in the epileptogenic region.
Using WGCNA, we identified the yellow co-expression module that contained genes that were specifically upregulated in the lesioned hippocampus of animals with seizures. a) Heatmap of expression within the yellow module, where each sample represents a column and genes are displayed in the rows. Expression is scaled for each gene, where red denotes that the gene is highly expressed in that sample and green denotes low expression. Below the heatmap is the ME that depicts the average gene expression throughout the module, and it demonstrates that the genes in this module are mostly upregulated in the lesioned hippocampus of animals with seizures. b) Network plot using VisAnt that shows the top three hundred connections within a module, where connection strength is calculated by TO [26]. The central positions of several genes are illustrated by this plot, including Nfe2l2 and Rdx. c) Barplot showing fold changes in expression for six genes within the yellow module using qRT-PCR. The y-axis represents the fold changes between the right (lesioned; red) and left (non-lesioned; blue) hemispheres in epileptic and non-epileptic animals separately. Fold changes from the microarray data are shown for comparison. All genes show significantly higher levels of expression in the lesioned hemisphere of animals with seizures, while there was no significant change in animals without seizures (p<0.05). β-actin was used as a loading control for qRT-PCR. Error bars represent the standard deviation.

