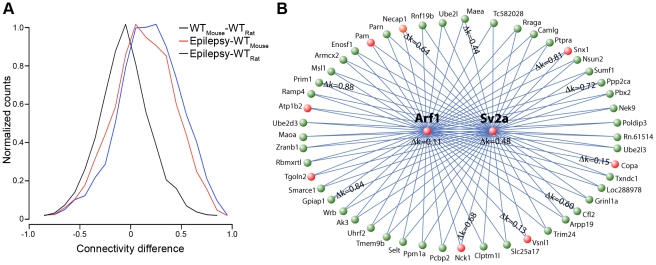
Figure 10. Genes involved in synaptic vesicle trafficking become more highly connected in epilepsy and are possible drug targets.
We examined whether the seizure network was conserved across other datasets, using two published gene expression datasets. a) Histogram of differences in connectivity within the synaptic vesicle trafficking module between different gene expression studies, including our study of epilepsy, a study of expression in specific neuronal sub-types from mice (WTMouse) [36], and a study of expression within the non-epileptic dentate gyrus from rats (WTRat) [37]. The x-axis represents the connectivity difference is the difference in k ME between the studies that are denoted on the legend. The y-axis represents the normalized number of genes that demonstrate the indicated connectivity difference. b) Network plot of the fifty closest genes to both Arf1 and Sv2a, which were identified using the multi-point topological overlap measure [39]. Genes marked in red are known to be involved in vesicular transport or present in synaptic vesicles based on annotations from GO. For genes that had probes targeting the same exon in the epileptic and normal networks, we calculated the difference in kME between these networks and displayed these values on the network plot. Higher values demonstrate that the gene has become more important within the module, suggesting that it has gained a more substantial role in synaptic vesicle trafficking in neurons subject to seizure activity.

