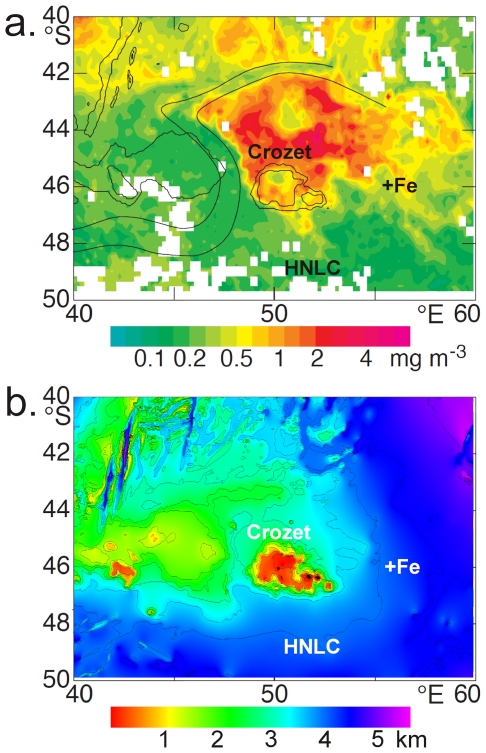
Figure 1. Location maps of the +Fe and HNLC sites with respect to:
a. monthly (October 1998) SeaWiFS chlorophyll (mg m−3) distribution, showing a typical spring bloom to the north of the Crozet Plateau (adapted from Ref. 15), with the meander of the Sub-Antarctic Front indicated by parallel black lines. b. Water depth (km) in the corresponding Crozet region (derived from the General Bathymetric Chart of the Oceans, Centenary Edition).

