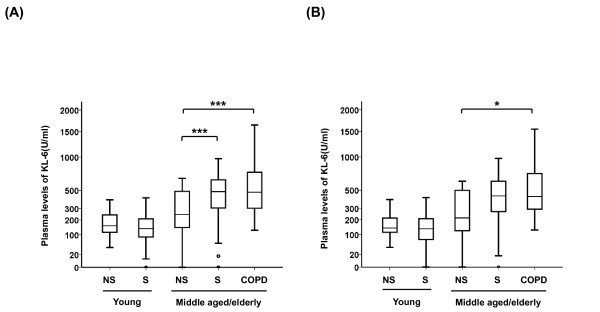
Figure 1.
KL-6 levels in plasma. KL-6 levels in plasma obtained from young subjects (non-smokers; NS and smokers; S) and middle aged/elderly subjects (non-smokers, smokers and COPD) in (A) both males and females, and in (B) males only. The box represents the 25th to 75th percentiles, the solid lines within the boxes show the median values, the whiskers are the 10th and 90th percentiles, and the points represent outliers. Horizontal bars indicate mean values. †p < 0.05; ††p < 0.01; †††p < 0.001 (young non-smokers vs young smokers, Mann-Whitney U test). *p < 0.05; **p < 0.01; ***p < 0.001 (middle aged/elderly non-smokers vs middle aged/elderly smokers or COPD, Mann-Whitney U test).

