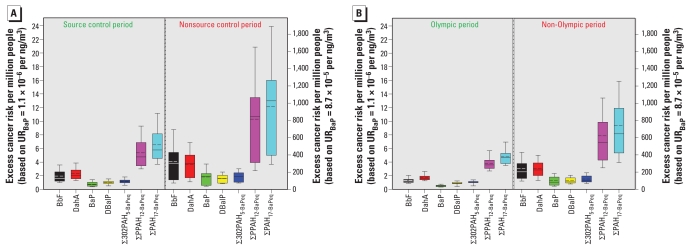
Figure 3.
Estimated number of excess inhalation cancer cases for selected PAHs during the source control and nonsource control periods (A) and during the Olympic and non-Olympic periods (B): left y-axes, based on a URBaP of 1.1 × 10⁻⁶ per ng/m3 from a rodent study (OEHHA 1993); right y-axes, based on a URBaP of 8.7 × 10⁻⁵ per ng/m3 from an epidemiology study (WHO 2000). The boxes represent the 25th and 75th percentiles, the whiskers represent the 10th and 90th percentiles, and the short dash and solid lines within the boxes represent the mean and median, respectively.

