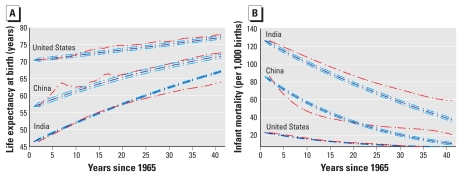
Figure 1.
Time-series AR model results for LE at birth (A) and IM (B) in the United States, China, and India, representing the highest population countries in the low-IM/high-LE, mid-IM/LE, and high-IM/low-LE groups, respectively. LE at birth (years) and IM (per 1,000 live births) are plotted in red; results of the model described by Equation 1, including 95% confidence intervals, are plotted in blue. Adjusted R2 values are 0.92 (India), 0.74 (China), and 0.66 (United States) for LE models and 0.79 (India), 0.87 (China), and 0.92 (United States) for IM models.

