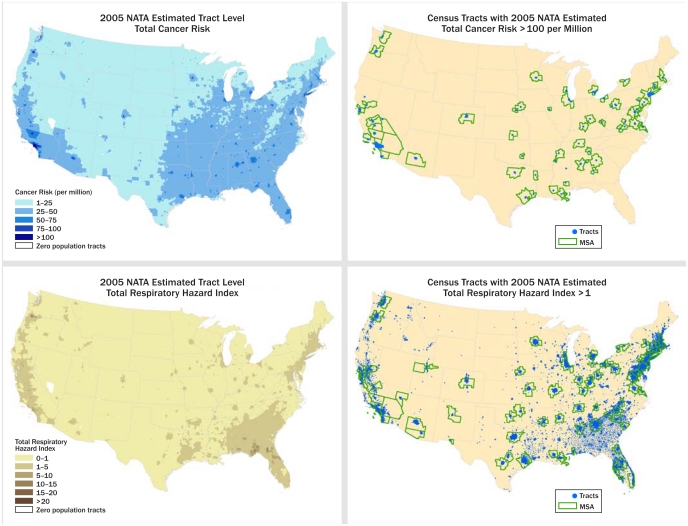
The fourth edition of NATA includes Google Earth maps that show estimated risk levels for each census tract. Individual state maps available at http://tinyurl.com/648h4xv can be downloaded and used to identify the estimated risk averaged across the tract as well as the air toxics contributing to risk levels and their estimated contribution.

An official website of the United States government
Here's how you know
Official websites use .gov
A
.gov website belongs to an official
government organization in the United States.
Secure .gov websites use HTTPS
A lock (
) or https:// means you've safely
connected to the .gov website. Share sensitive
information only on official, secure websites.
