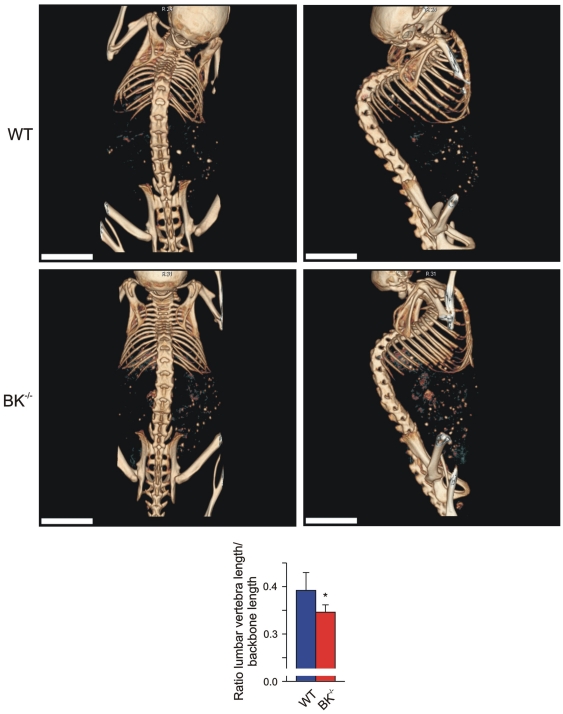
Figure 5. Osteopenic phenotype in juvenile BK−/− mice.
Representative, non-invasive imaging with fpVCT from total backbone in a dorsal (left) and lateral (right) view from a WT (Upper) and a BK−/− mouse (Middle); bar: 5 mm. Lower: Statistical summary of ratio between length of 5 lumbar vertebrae and total length of backbone (n = 6 per genotype) obtained from non-invasive fpVCT imaging. All data are means±SD; *P<0.05; **P<0.01.

