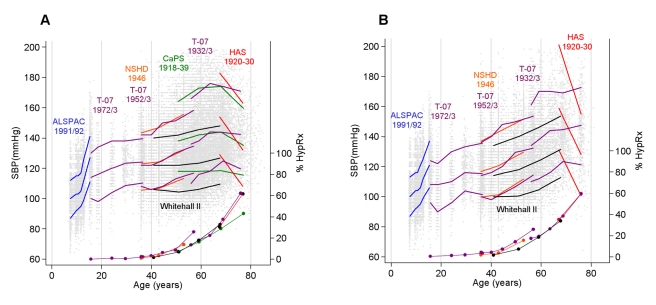
Figure 1. Observed SBP and prevalence of antihypertensive therapy.
Observed median and 10th and 90th centiles for SBP (in millimetres of mercury) at each wave in each cohort (for the CaPS and WHII cohorts this is the median in 10-y intervals to allow for the wide age distribution at each wave) and the prevalence (percent) of HypRx use (filled circles) in men (A) and women (B). Individual SBP data points are also plotted. Data presented here do not include an added constant to account for BP medication.

