
Figure 1. Projection plot of the common thalamo-centric network.
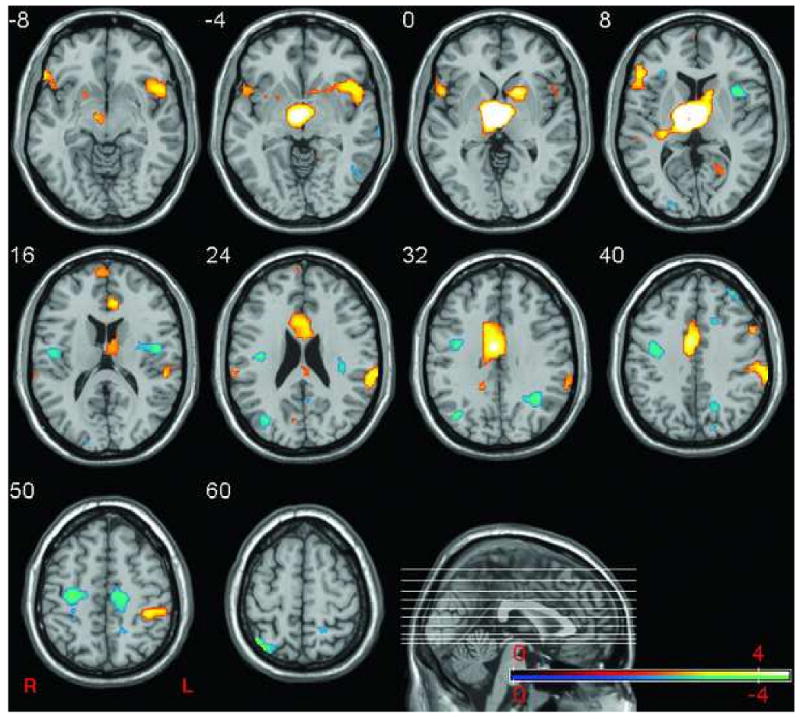
The plot depicts the network of brain regions that reliably correlated with the right thalamus (MNI, 4, 8, 4) across conditions and sex. Blue regions indicate regions with negative salience and correlated negatively with the thalamus. Red regions denote areas of positive salience that correlated positively with the thalamus. Sagittal section shows location of selected axial slices in the Z-plane plane of MNI space.