
Figure 3. Projection plot of sex-related amygdalo-centric network.
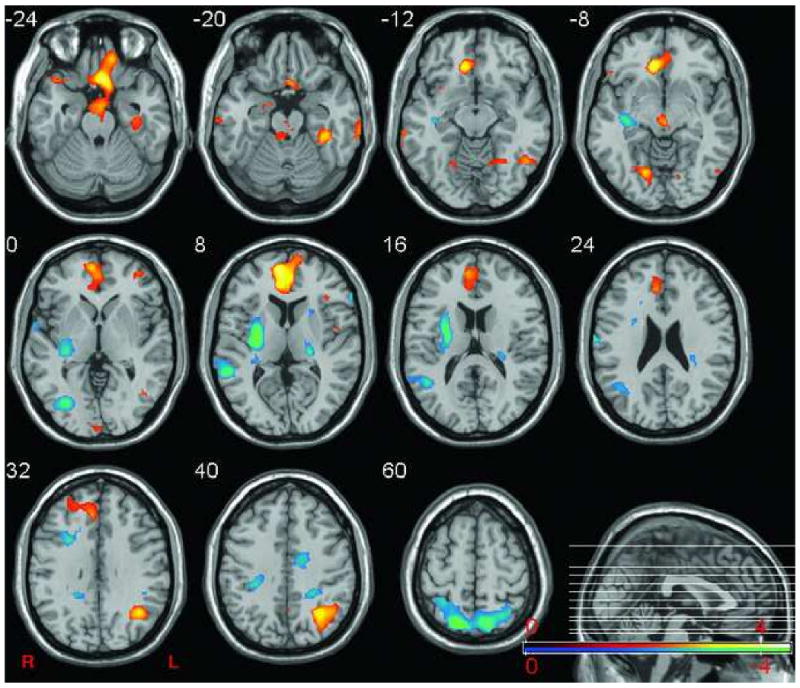
The plot shows the network of regions that reliably correlating with amygdalae (MNI ±20,-5,-17) across conditions. For females, blue regions indicate regions correlated negatively with the bilateral amygdala activity and yellow regions denote areas that correlated positively with the amygdalae. For men, blue regions indicate regions correlated positively with the amygdalae and yellow regions denote areas that correlated negatively. Sagittal section shows location of selected axial slices in the Z-plane of MNI space.