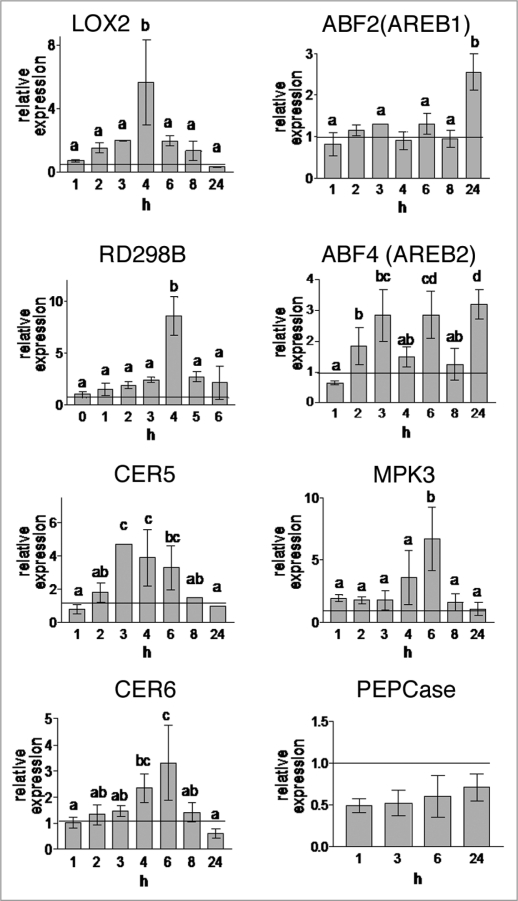
Figure 1.
Effects of the monoterpenes on gene expressions analyzed by qRT-PCR. The abundance of mRNA (x fold) is shown relative to the control values referred as to 1 (line). Mean values ± SD of three independent experiments. Letters above the histogram bars refer to statistically significant differences (p < 0.05) within groups as determined by Duncan test. Values marked by the same or no letter are not significantly different within bar values.

