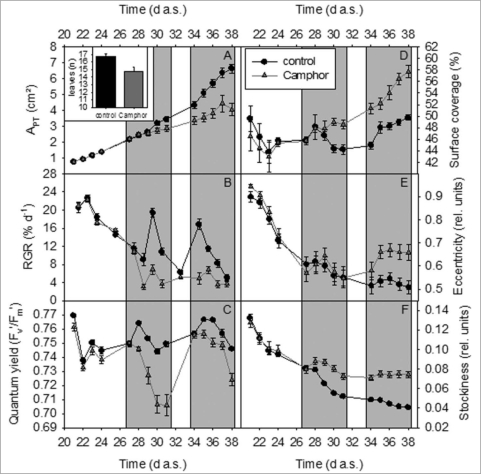
Figure 3.
Modification of A. thaliana phenotypes analyzed with GROWSCREEN FLUORO. Black lines/bars: control treated plants, grey lines/bars camphor treated plants. (A) projected leaf area (APT), insert in (A), amount of leaves at the final data acquisition; (B) relative growth rate (RGR); (C) quantum yield; (D) surface coverage; (E) eccentricity; (F) stockiness. Dark background indicates periods of fumigation.

