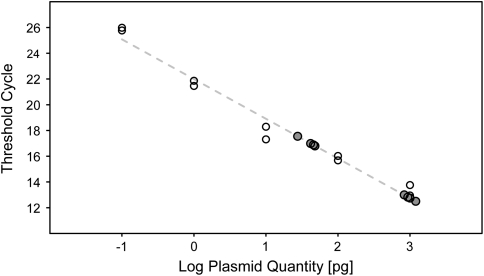
Fig. 3.
Real-time PCR analysis of the library size. The real-time PCR threshold cycle (Ct) values obtained from five different pRD-ZWT template amounts (0.1, 1, 10, 100, and 1000 pg) were plotted in a logarithmic scale. The data were fitted using linear regression (gray dashed line) and from the regression line, the amount of successfully ligated plasmids in two different dilutions of the library ligation reaction was determined (quadruplicates, filled circles). A low estimate of the library size, calculated using the mean value from the quadruplicate referring to the more diluted sample, was approximately 1 × 10¹¹

