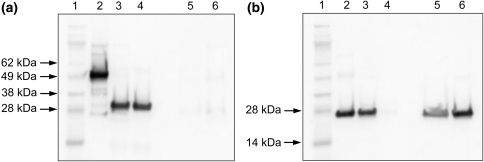
Fig. 8.
Western Blot analysis of mAb3 Fab fragment capture after papain cleavage. The mouse IgG1 mAb3 was papain-digested and the sample applied on a HiTrap™ HP column with Zmab25 immobilized as ligand for capture of the targets for the ligand. Panel a was stained with a polyclonal goat anti-mouse IgG Fc HRP conjugate. Lane 1: SeeBlue® Plus2 Pre-Stained standard; lane 2: mAb3 sample before cleavage; lane 3: mAb3 sample after cleavage; lane 4: column flow-through fraction; lanes 5, 6: eluate fractions. Panel b was stained with a polyclonal goat anti-mouse IgG F(ab)2 HRP conjugate. Lane 1: SeeBlue® Plus2 Pre-Stained standard; lane 2: mAb3 sample before cleavage; lane 3: mAb3 sample after cleavage; lane 4: column flow-through fraction; lanes 5, 6: eluate fractions. The black arrows to the left indicate molecular weights in kilo Dalton (kDa)

