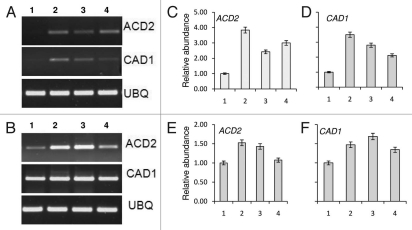
Figure 4.
Expression of cell death associated genes in A. thaliana seedlings post (±)-catechin treatment. The seedlings were treated with different concentrations of (±)-catechin (50–200 µg ml−1) and the total RNA was isolated from the seedlings on day 3 and 5 post (±)-catechin treatment. (A) Expression analyses of ACD2, CAD1 genes, 3 days after (±)-catechin treatments. (B) Expression analyses of ACD2, CAD1 genes, 5 days after (±)-catechin treatments. 1 in both panels refers to control (without catechin) treatments. 2–4 in both panels refers to (±)-catechin treatments in an increasing order of 50–200 µg ml−1. RT-PCR was performed with 500 ng of total RNA. The PCR products were analyzed by agarose gel electrophoresis. The band intensity of each gene was adjusted with the band intensity of housekeeping gene ubiquitin. (C–F) show the relative expression levels post normalization. Data shown are mean ± SD of three independent experiments expressed as the fold increase in ACD2 and CAD1 genes of different concentrations of (±)-catechin (50–200 µg ml−1) added to Arabidopsis seedlings normalized with the value for respective control plants.

