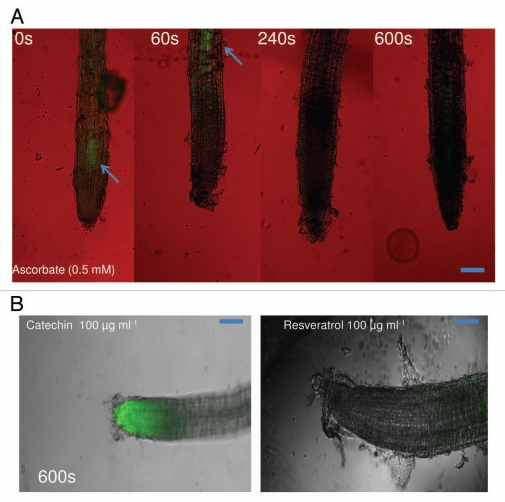
Figure 6.
Induction of root surface reactive oxygen species (ROS) by ascorbate (0.5 mM) and resveratrol at (100 µg ml−1) on A. thaliana seedlings. ROS generation was analyzed for over a 10-min time period. The representative scans for (B) for resveratrol are shown for 600 s. The green fluorescence (arrows in A) in the panel indicates generation of ROS. The images are confocal scanning laser micrographs and each image is representative of the roots of at least six independent plants analyzed and imaged. (Scale bars: 100 µM for ROS images). See Materials and Methods for details on microscopy and staining methodology.

