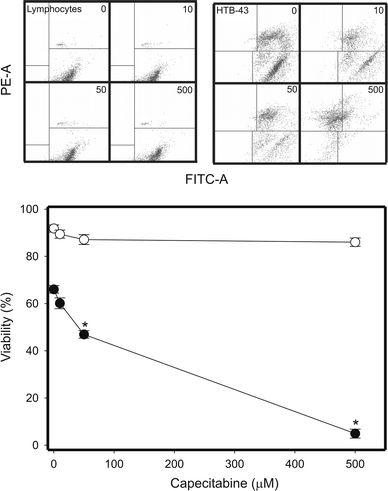
Fig. 2.

Viability of head and neck squamous cell carcinoma HTB-43 cells (closed symbols) and normal human lymphocytes (open symbols) exposed to CAP for 1 h at 37°C and measured by flow cytometry with thiazole orange and PI. Displayed is the mean of three experiments of 5 × 10⁴ measurements each, error bars denote standard deviation, *P < 0.001. The contour diagrams above the plot show results for one representative experiment out of three for each CAP concentration
