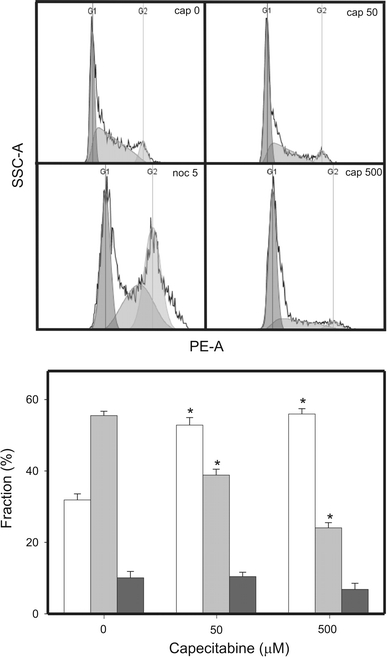
Fig. 8.

Cell cycle analysis in HTB-43 cells exposed to CAP. Fraction of cells in G0/G1 (white bars), S (light grey bars) and G2/M (dark grey bars) stage of cell cycle after treatment with CAP was presented along with histograms for each CAP concentration. Nocodazole at 5 μM was used as a positive control. Data are expressed as means of at least three independent experiments, error bars denote SD, *P < 0.001 as compared with unexposed control
