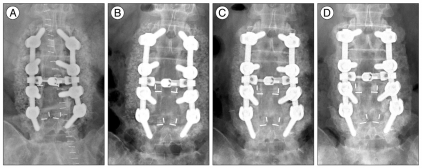
Fig. 2.
A : Stage I. The fusion mass density is similar to that of the adjacent vertebra and small particles are seen. B : Stage II. The density of the fusion mass seems to be denser and particles are more prominent. C : Stage III. The particles begin to disappear, and the density of the fusion mass seems to lower than in stage II. The gaps, which is seen low density, among the bone chips begin to disappear. D : Stage IV. The fusion mass appears to be a connected bone bridge with a density similar to the adjacent vertebra.

